See you at our new site: metascape.org/blog
(updated on Mar 22, 2019)
Backup site: metascapeblog.wordpress.com
Metascape is a free gene annotation and analysis resource that helps biologists make sense of one or multiple gene lists. Metascape provides automated meta-analysis tools to understand either common or unique pathways within a group of orthogonal target-discovery studies. Contact: metascape.team at gmail dot com.
Tuesday, November 20, 2018
Saturday, September 15, 2018
How to Adjust Metascape Network Plots?
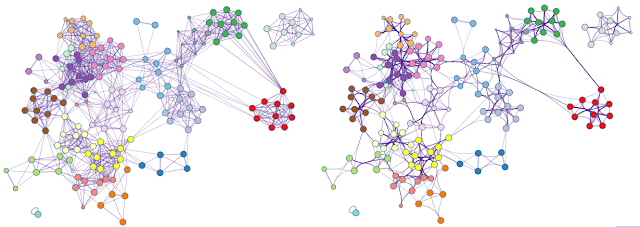
Metascape relies on Cytoscape [1] to render networks, including both enrichment networks and protein-protein interaction networks. When a network contains too many edges, it can become a visual "hair ball" and no longer serves as an intuitive depiction. Such visual clutter can be significantly reduced by an edge bundling algorithm [2] implemented in Cytoscape (Figure 1).
To bundle edges in Cytoscape, use menu Layout > Bundle Edges > All Nodes and Edges (Figure 2). The default parameters work well for most networks.
Since edge bundling is so useful, it is used by default in network visualization outputs generated by Metascape. For example, Figure 3 shows an enrichment network generated based on four input gene lists.
Sometimes, users would like to rearrange the nodes in the exported network, in order to better illustrate its biological context. Simply moving the nodes, for instance the red cluster in Figure 3, can result in floppy edges (Figure 4). We sometimes see unaesthetic network plots due to this limitation, Figure 5 is an example taken from a recent publication.
To adjust Metascape networks, we first need to use the menu option Layout > Clear All Edge Bends. This will straighten all edges, then you can move the nodes around (the result is in Figure 6, left). Once you are happy with the new locations of the nodes, simply use Layout > Bundle Edges > All Nodes and Edges to bundle the edges again (right).
1. http://cytoscape.org
2. http://citeseerx.ist.psu.edu/viewdoc/download?doi=10.1.1.212.7989&rep=rep1&type=pdf
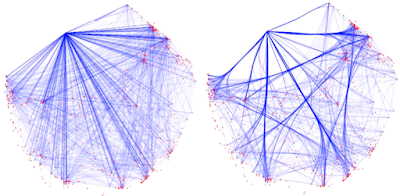 |
| Figure 1. An example network rendered with straight edges (left) and bundled edges (right). High-level network edge patterns are more readily visible in the latter case. Screenshots were taken from a YouTube video here. |
 |
| Figure 2. Operations lead to edge bundling in Cytoscape. |
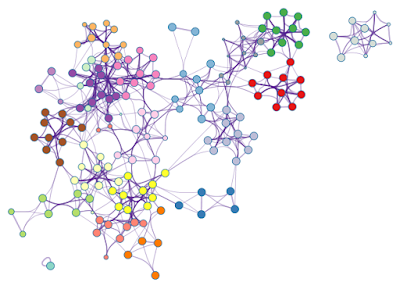 |
| Figure 3. An enrichment network, where each node is colored by its cluster ID. |
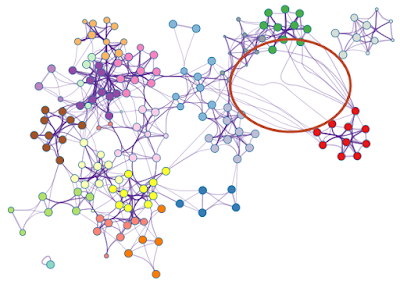 |
| Figure 4. Simply moving the nodes for the red cluster results in floppy edges circled in red. |
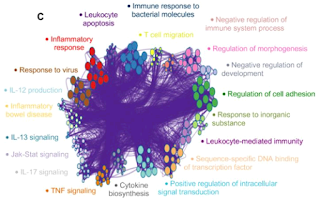 |
| Figure 5. Floppy bundled edges can lead to unreadable networks. The example is Figure 5.C taken from this PubMed entry. |
Referene
1. http://cytoscape.org
2. http://citeseerx.ist.psu.edu/viewdoc/download?doi=10.1.1.212.7989&rep=rep1&type=pdf
Wednesday, January 31, 2018
Analysis Report Available Offline
A major goal of Metascape is to facilitate communication by presenting bioinformatics analysis results in a way that is easily interpretable to biology users. More specifically, Metascape presents data in an article-style web page called Analysis Report (Figure 1).
(1) An Excel file, where tabular data are conditionally-formatted and gene candidates can be easily sorted and filtered based on 1/0 binary columns. Many publications use the spreadsheet output as journal supplementary files.
(2) A PowerPoint presentation, where slides include key visualizations to help users share findings. Each slide also contains detailed explanations in the note session, so user can interpret the graphics better and be prepared to answer technical questions from their audience.
(3) All data files and figures are packaged into a Zip file. Figures include publication-quality formats such as PDF or SVG formats, or formats that can be further manipulated by third-party tools (such as Cytoscape). So far, 61% of the publications citing Metascape include graphics as figures, making it self-evident that these graphics are indeed interpretable and publication ready.
To protect your data privacy and to also avoid complicated login process, Metascape tags each of your analysis request with a randomly-generated session ID and the Analysis Report can be retrieved by the associated URL for three days. Although the Zip file can be downloaded and stored locally, the Analysis Report itself are only available online. After three days, session results are deleted, users would need to reanalyze the data in order to produce the Analysis Report again.
With the latest update (Jan 30, 2018), the Zip package now contains an AnalysisReport.html file as well. This means users can now download the Zip package, unzip it into a folder, then open to read the AnalysisReport.html file offline in a browser.
In short, Analysis Report can now be stored locally and be shared with others! We hope you like it.
Subscribe to:
Comments (Atom)
