See you at our new site: metascape.org/blog
(updated on Mar 22, 2019)
Backup site: metascapeblog.wordpress.com
Metascape
Metascape is a free gene annotation and analysis resource that helps biologists make sense of one or multiple gene lists. Metascape provides automated meta-analysis tools to understand either common or unique pathways within a group of orthogonal target-discovery studies. Contact: metascape.team at gmail dot com.
Tuesday, November 20, 2018
Saturday, September 15, 2018
How to Adjust Metascape Network Plots?
Metascape relies on Cytoscape [1] to render networks, including both enrichment networks and protein-protein interaction networks. When a network contains too many edges, it can become a visual "hair ball" and no longer serves as an intuitive depiction. Such visual clutter can be significantly reduced by an edge bundling algorithm [2] implemented in Cytoscape (Figure 1).
To bundle edges in Cytoscape, use menu Layout > Bundle Edges > All Nodes and Edges (Figure 2). The default parameters work well for most networks.
Since edge bundling is so useful, it is used by default in network visualization outputs generated by Metascape. For example, Figure 3 shows an enrichment network generated based on four input gene lists.
Sometimes, users would like to rearrange the nodes in the exported network, in order to better illustrate its biological context. Simply moving the nodes, for instance the red cluster in Figure 3, can result in floppy edges (Figure 4). We sometimes see unaesthetic network plots due to this limitation, Figure 5 is an example taken from a recent publication.
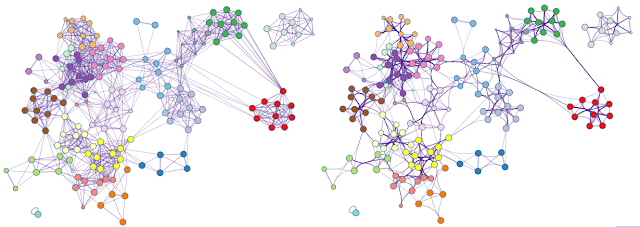
To adjust Metascape networks, we first need to use the menu option Layout > Clear All Edge Bends. This will straighten all edges, then you can move the nodes around (the result is in Figure 6, left). Once you are happy with the new locations of the nodes, simply use Layout > Bundle Edges > All Nodes and Edges to bundle the edges again (right).
1. http://cytoscape.org
2. http://citeseerx.ist.psu.edu/viewdoc/download?doi=10.1.1.212.7989&rep=rep1&type=pdf
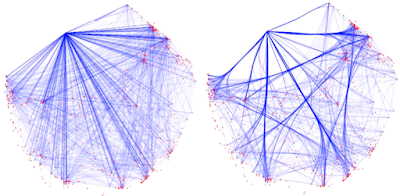 |
| Figure 1. An example network rendered with straight edges (left) and bundled edges (right). High-level network edge patterns are more readily visible in the latter case. Screenshots were taken from a YouTube video here. |
 |
| Figure 2. Operations lead to edge bundling in Cytoscape. |
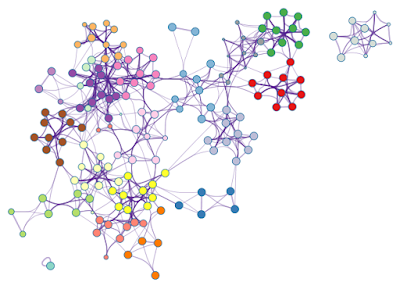 |
| Figure 3. An enrichment network, where each node is colored by its cluster ID. |
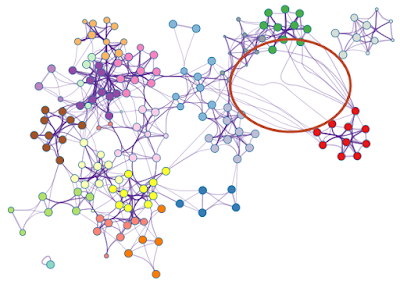 |
| Figure 4. Simply moving the nodes for the red cluster results in floppy edges circled in red. |
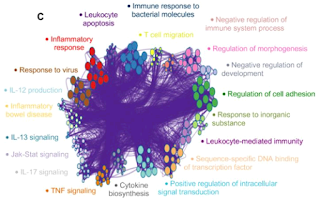 |
| Figure 5. Floppy bundled edges can lead to unreadable networks. The example is Figure 5.C taken from this PubMed entry. |
Referene
1. http://cytoscape.org
2. http://citeseerx.ist.psu.edu/viewdoc/download?doi=10.1.1.212.7989&rep=rep1&type=pdf
Wednesday, January 31, 2018
Analysis Report Available Offline
A major goal of Metascape is to facilitate communication by presenting bioinformatics analysis results in a way that is easily interpretable to biology users. More specifically, Metascape presents data in an article-style web page called Analysis Report (Figure 1).
(1) An Excel file, where tabular data are conditionally-formatted and gene candidates can be easily sorted and filtered based on 1/0 binary columns. Many publications use the spreadsheet output as journal supplementary files.
(2) A PowerPoint presentation, where slides include key visualizations to help users share findings. Each slide also contains detailed explanations in the note session, so user can interpret the graphics better and be prepared to answer technical questions from their audience.
(3) All data files and figures are packaged into a Zip file. Figures include publication-quality formats such as PDF or SVG formats, or formats that can be further manipulated by third-party tools (such as Cytoscape). So far, 61% of the publications citing Metascape include graphics as figures, making it self-evident that these graphics are indeed interpretable and publication ready.
To protect your data privacy and to also avoid complicated login process, Metascape tags each of your analysis request with a randomly-generated session ID and the Analysis Report can be retrieved by the associated URL for three days. Although the Zip file can be downloaded and stored locally, the Analysis Report itself are only available online. After three days, session results are deleted, users would need to reanalyze the data in order to produce the Analysis Report again.
With the latest update (Jan 30, 2018), the Zip package now contains an AnalysisReport.html file as well. This means users can now download the Zip package, unzip it into a folder, then open to read the AnalysisReport.html file offline in a browser.
In short, Analysis Report can now be stored locally and be shared with others! We hope you like it.
Thursday, December 14, 2017
How We Keep Data Fresh?
We live in a big data era, where biological data and thus knowledge extracted grow rapidly. Tools such as Metascape sit on top of various bioinformatics knowledge bases; the quality of analysis results heavily depends on the freshness of the underlying data content.
We know DAVID had not been updated for over ten years, as the result of this, Wadi et al. estimated a total of 2,601 publications within the year 2015 alone only captured ~20% of the annotations compared to what should have been captured [1]! Given all the efforts and costs went into generating our precious data sets, losing 80% of insights due to an outdated tool is a serious issue. Although DAVID finally updated its database after Wadi's publication, no more activity afterwards, 1.5 year went by and counting ...
At Metascape, one of our main goals is to keep our data sources Sushi-fresh. Metascape's update engine used to run once a month. However, due to the large amount of data sources Metascape integrates (Figure 1) and over ten organisms it covers, the automated pipeline broke a few times due to format changes in some sources, due to mistakes in missing species-specific data in NCBI, due to data sources switched to a more protected access mode for funding reasons (OMIM), etc. The volunteers at Metascape were no longer able to keep up with these changes at a monthly bases, therefore, we see some lag in our updates this year.
First, when the pipeline failed to fetch a data source, the copy from the previous snapshot will be used, so that computation can continue unaffectedly. We will certainly be notified and take actions afterwards (sometimes the fix can take a while if the issue resides on the data provider's side). Nevertheless, we will be able to produce a release.
Second, the pipeline automatically generates a graphical report at the end, comparing data in the new release to its previous one. An example report is shown here. This is critical to catch issues that do not cause code to crash, e.g., all locus_tag for a certain species is missing in the new NCBI release. The report will be reviewed by us, before we trigger the official deployment of the new knowledge base. The snapshot below (Figure 2) is compiled for A. thaliana. It is very clear that there are some additions to UniPro identifiers highlighted in green, and some GO annotations highlighted in orange were removed probably due to clean up efforts by curators. As these changes are minor, we can assume there is no obvious issue in the new release. Outstanding green/orange bars will deserve our attention, in that case, release will be held off and a careful examination is required.
We believe with these two new mechanisms in place, Metascape will continue to provide fresh data, so that our users can always extract the maximum value from gene lists.
Metascape has been cited over 70 times by the time of this blog [link], thank you for using Metascape and help spread the words. The best reward for Metascape volunteers is to see Metascape helping users.
Reference
1. Wadi L, et al. Impact of outdated gene annotations on pathway enrichment analysis. Nat Methods. 2016 Aug 30;13(9):705-6. [link]
We know DAVID had not been updated for over ten years, as the result of this, Wadi et al. estimated a total of 2,601 publications within the year 2015 alone only captured ~20% of the annotations compared to what should have been captured [1]! Given all the efforts and costs went into generating our precious data sets, losing 80% of insights due to an outdated tool is a serious issue. Although DAVID finally updated its database after Wadi's publication, no more activity afterwards, 1.5 year went by and counting ...
At Metascape, one of our main goals is to keep our data sources Sushi-fresh. Metascape's update engine used to run once a month. However, due to the large amount of data sources Metascape integrates (Figure 1) and over ten organisms it covers, the automated pipeline broke a few times due to format changes in some sources, due to mistakes in missing species-specific data in NCBI, due to data sources switched to a more protected access mode for funding reasons (OMIM), etc. The volunteers at Metascape were no longer able to keep up with these changes at a monthly bases, therefore, we see some lag in our updates this year.
First, when the pipeline failed to fetch a data source, the copy from the previous snapshot will be used, so that computation can continue unaffectedly. We will certainly be notified and take actions afterwards (sometimes the fix can take a while if the issue resides on the data provider's side). Nevertheless, we will be able to produce a release.
Second, the pipeline automatically generates a graphical report at the end, comparing data in the new release to its previous one. An example report is shown here. This is critical to catch issues that do not cause code to crash, e.g., all locus_tag for a certain species is missing in the new NCBI release. The report will be reviewed by us, before we trigger the official deployment of the new knowledge base. The snapshot below (Figure 2) is compiled for A. thaliana. It is very clear that there are some additions to UniPro identifiers highlighted in green, and some GO annotations highlighted in orange were removed probably due to clean up efforts by curators. As these changes are minor, we can assume there is no obvious issue in the new release. Outstanding green/orange bars will deserve our attention, in that case, release will be held off and a careful examination is required.
Metascape has been cited over 70 times by the time of this blog [link], thank you for using Metascape and help spread the words. The best reward for Metascape volunteers is to see Metascape helping users.
Reference
1. Wadi L, et al. Impact of outdated gene annotations on pathway enrichment analysis. Nat Methods. 2016 Aug 30;13(9):705-6. [link]
Monday, January 30, 2017
Protein-protein Network Analysis
The protein-protein interaction (PPI) network analysis was introduced into Metascape (http://www.metascape.org) on Nov 2, 2016. We initially relied on BioGRID [1] as the proxy of all public-domain physical protein-protein interaction data sources. BioGRID contains over 200k unique human PPI interactions, it is well maintained and frequently updated. Its coverage of all organisms fit very well with our goal to support key model organisms.
The quality of the PPI network analysis certainly depends on the underlying PPI database, therefore, we have been keeping an eye on new PPI data sources. Two recent members caught our attention: OmniPath [2] and InWeb_IM [3], published in Nature Method at the end of 2016. OminPath focuses on human signal-interactions from literature-curated signal pathways, while InWeb_IM focuses on integrating and scoring physical PPI pairs from eight resources (BIND, BioGRID, DIP, IntAct, MatrixDB, NetPath, Reactome, WikiPathways). In addition, InWeb_IM also uses a conservative ortholog mapping approach to "transfer" some interactions from non-human to human.
The following is the Venn diagram showing the overlap of unique human physical PPI pairs among the three databases. Metascape now uses the combined database (~600k) that triples the number of human interactions provided by BioGRID alone. Readers might notice BioGRID is one of the eight sources for InWeb_IM, then an immediate question is why there are still a portion of BioGRID not covered by InWeb_IM? Communications with the authors clarified the puzzle, InWeb_IM only retains data for the proteins that have been reviewed by UniProtKB. E.g., R9QTR3 [4] is "unreviewed" at this time. It interacts with SSX2 and SSX3 according to BioGRID, however, it has no data in InWeb_IM.
Out of curiosity, we compared the public-domain data to a commercial literature-based human PPI database. There remains a large discrepancy. Although protein-protein interactions have many dependencies, such as post-translational modifications, the time dimension - complexes are not formed until key proteins are available, etc., since the commercial database is also literature-based, the weak overlap deserves some attention. We have not done detailed analysis on this topic, nevertheless, a quick search using TLR7 as an example identified unique PPI interactions found by either sources. TLR7-MMP9 interaction was found in the commercial source supported by a co-immuno-precipitation study [5], this is a valid link missed by the public sources. Most of the InWeb_IM-only links were orginated from interactions inferred through ortholog data, understandably missed by the commercial database. TLR7-MLF1 interaction was included in the InWeb_IM release file (through UniProt ID: P58340 and Q9NYK1), indicating there is experimental support missed by the commercial source. However, this interaction pair has a confidence score of 0.148, which is considered lower than the threshold used in the InWeb_IM web tool. However, no threshold was mentioned in the InWeb_IM publication and private communications with the authors confirmed that the analyses presented in the paper were largely based on all interaction pairs; we retain all interaction pairs for Metascape analysis. We also need to point out that commercial database also contains non-PPI interactions (not included in the Venn diagram), such as protein-gene regulation, which is still meaningful for network analysis. Our initial check indicates commercial sources contains many literature-based PPI data that is missed by the public sources, while public sources provide some additional experimental data and some inferred interactions. They remain complementary.
A comprehensive PPI database is only one side of a coin for an informative PPI analysis. The PPI analysis in Metascape is rather unique in the way that we automatically apply Molecular Complex Detection (MCODE) algorithm [6] to the resultant networks to identify tightly connected network cores. This is extremely helpful when the larger network is hard to read. Metascape also automatically analyzes each network components for pathway enrichment, therefore assign them biological functions for easy interpretation. All networks identified are available in PNG, PDF and Cytoscape [7] formats. These are rather unique features compared to other online PPI analysis tools.
In summary, Metascape currently contains comprehensive public-domain PPI data sources, combined with its broad-spectrum algorithms, protein network analyses have never been better.
Reference:
- Stark C, et al. Nucleic Acids Res. 2006. 34:D535-539 (https://thebiogrid.org)
- Turei D, et al. Nat Methods. 2016. 13:966-967 (http://omnipathdb.org)
- Li T, et al. Nat Methods. 2017. 14:61-64 (https://www.intomics.com/inbiomap
- http://www.uniprot.org/uniprot/R9QTR3
- Abdulkhalek S., Szewczuk MR. Cellular Signal. 25 (2013) 2093–2105.
- Bader GD, Hogue CW. BMC Bioinformatics 2003. 4:2.
- Shannon P. et al. Genome Res (2003) 11:2498-2504.(http://cytoscape.org)
Wednesday, February 10, 2016
Watch out gene symbols within Excel
We do not recommend use gene symbols (or synonyms) as primary identifier within a gene list, especially within Excel. Excel irreversibly converts certain symbols into dates and it becomes much worse when gene synonyms are used.
We checked all primary human gene symbols, Excel automatically converts the following 35 symbols into dates: FEB1, FEB2, FEB5, FEB6, FEB7, FEB9, FEB10, MARCH1, MARC1, MARCH2, MARC2, MARCH3, MARCH4, MARCH5, MARCH6, MARCH7, MARCH8, MARCH9, MARCH10, MARCH11, SEPT1, SEPT2, SEPT3, SEPT4, SEPT5, SEPT6, SEPT7, SEPT8, SEPT9, SEPT10, SEPT11, SEPT12, SEPT14, SEP15, DEC1.
The conversion is irreversible for two reasons. First, the original symbol is lost and the cell only stores an integer representing the number of days since Jan 1, 1900. Second, notice both MARCH1 and MARC1 map to the same date, as well as MARCH2 and MARC2.
The situation become even worse, if we allow gene synonyms. E.g., SEP53 (Gene ID 49860) becomes Sep, 1953, 2E4 (Gene ID 11133) becomes 20000. 9-27 (Gene ID 8519) becomes Sep 27th.
It is a wild west, when we look into mouse and rat. There are primary symbols such as 201E9, 9130022E09, 3e46, NA, NaN, etc.
How to fix a gene symbol in Excel? To enter MARCH1 into a cell, type 'MARCH1 (prefix it with a single quote). This hints Excel to preserve the input, while the single quote is nicely invisible to Excel formula and in data export.
For all the reasons above, we recommend other gene identifier types to be used with Excel. Metascape supports Entrez Gene ID, RefSeq, UniProt, Ensembl and UCSC identifiers, which all work peacefully with Excel.
Tuesday, February 9, 2016
Why DAVID should no longer be used?
National Cancer Institute's DAVID provides a set of popular bioinformatics tools that help biologists make sense of a list of gene. However, evidences show that DAVID has not bee updated since January 2010 (Jan 27, 2010 according to Wikipedia)! The six-year old backend database makes DAVID an inadequate tool for our bioinformatics analysis.
On the DAVID home page, it shows the most recent DAVID version is 6.7, released on Jan 2010. Visit DAVID Forum, we can see DAVID team has not answered a single user post for the past six years. As a user concluded on the forum, "DAVID Died"!
Today we would like to systematically check how updated the backend database is behind DAVID.
First, we took all latest human Entrez Gene IDs (59803 in total) and tested DAVID's ID Conversion tool. DAVID only recognized 58% and missed 42%. As shown in the bar graph below, DAVID essentially missed 87% non-coding RNAs, as ncRNA became a hot topic only within the past three-four years and DAVID's database was too old to capture them. Things do not seem so bad for protein-coding genes, as we only lost 6.4%.
Second, we repeated the same experiment using the primary gene symbols (ignoring synonyms), and we chose to only focus on protein-coding genes. Among these 20921 symbols, DAVID failed to recognize 12.6%. Just to name a few, DXO, CTSV, ACKR1, MYCL, PKM, MYRF, etc.

Third, the same experiment with high-quality protein coding NM_* RefSeq entries shows DAVID missed 31.5% of the human transcriptome!
Our tests demonstrate DAVID is seriously aged. We all spend tremendous amount of resource in obtaining our gene list, why should we compromise our discoveries by using a six-year old resource? This is why we created Metascape as a DAVID replacement. Metascape always keep its data source fresh, try it today!
Subscribe to:
Comments (Atom)
